Arrow Exploration Remains Static Amid Market Volatility
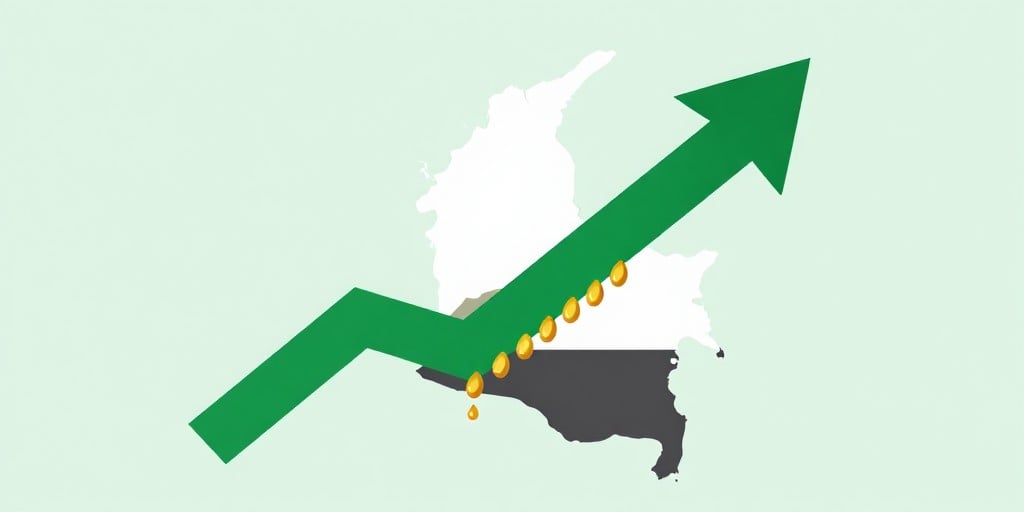
Arrow Exploration (AXL.L) finished the trading session on Wednesday, 21 September 2026, unchanged at CAD 0.71—a flat 0 % move over the 24‑hour period ending 08:56 PM Central Europe. The junior oil‑and‑gas explorer, listed on the TSX Venture Exchange and active in Colombia and Western Canada, has seen its share price hold steady despite a broader market that is in the throes of fluctuation.
Market Snapshot
- Current price: CAD 0.71
- Outstanding shares: 285.9 million
- Market capitalization: CAD 200.1 million
- 24‑hour trading volume: CAD 221.9 k
- Month‑end change: +7.58 %
- 200‑day simple moving average (SMA): CAD 0.46
- 52‑week high: CAD 0.73 (22 September 2026)
- 52‑week low: CAD 0.20 (20 November 2025)
Arrow Exploration’s price sits almost 55 % above its 200‑day SMA, a technical indicator that could suggest an overbought position. Yet the shares remain unmoved, indicating a potential disconnect between price momentum and investor confidence.
Comparative Performance
The following table shows how other peer stocks have behaved in the same 24‑hour window:
| Stock | 24‑hour change | Current price | Market cap | Notable metrics |
|---|---|---|---|---|
| Nervgen Pharma (NGEN) | 0 % | USD 1.52 | USD 165.6 M | – |
| Goliath (GOT.V) | -1.13 % | CAD 1.29 | CAD 236.7 M | – |
| Scottie (SCOT.V) | -4.91 % | CAD 2.53 | CAD 236.2 M | – |
| Medical Facilities (DR.TO) | +1.82 % | CAD 14.63 | CAD 232.2 M | P/E = 12.35 |
| Lycos Energy (LCX.V) | -1.66 % | CAD 1.74 | CAD 238.7 M | P/E = 29.25 |
While Medical Facilities registers a modest gain and a low price‑to‑earnings ratio, most peers—including the oil‑sector competitor Lycos Energy—are retreating. Arrow’s flat performance, therefore, is not an isolated anomaly; it reflects a broader sectoral inertia.
What the Numbers Say
Arrow’s flat 24‑hour result, coupled with a month‑to‑date rise of 7.58 %, signals a plateau rather than a surge. The share price’s proximity to the 52‑week high—just 0.02 CAD below its peak—suggests that the market may soon reassess the company’s valuation. Investors should note that a price hovering near its 52‑week high, while historically bullish, can also herald a potential correction if fundamentals do not sustain the upward trajectory.
Moreover, the 200‑day SMA at CAD 0.46 is a critical support level. A breach below this threshold could trigger a cascade of sell orders, dragging the stock further down. The current trading volume of CAD 221.9 k is modest, indicating limited liquidity; sudden market movements could therefore be disproportionately amplified.
The Bottom Line
Arrow Exploration’s price stagnation is a warning flag for market participants. In a landscape where most contemporaries are declining, the company’s inability to gain traction—even as it approaches a historical high—raises questions about its operational momentum and investor appetite. Unless Arrow can demonstrate tangible progress in its Colombian and Canadian exploration projects, the market may soon relegate the share to the same downward drift that has plagued its peers.