Next Generation G (319A.T) Trade Summary
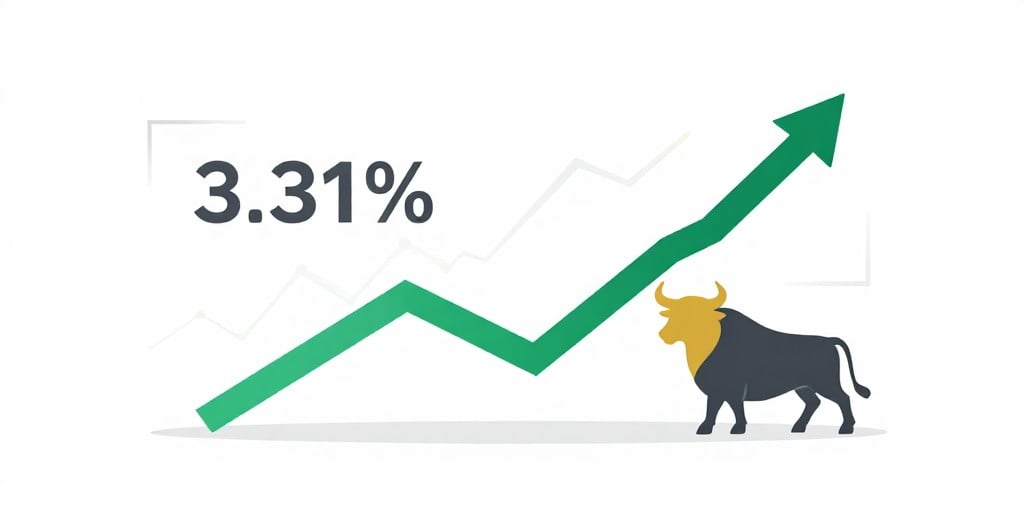
- Closing performance: Down 3.31 % during the 24‑hour period ending 09:24 AM Central Europe on Friday 23 Oct 2026.
- Current price: JPY 22,040 on major exchanges.
- Outstanding shares: 9.1 million.
- Market capitalization: JPY 211.3 billion.
- Volume (last 24 h): JPY 619.1 million worth of shares traded.
- Monthly change: Up 19.69 % since the end of the previous month.
- 200‑day moving average: JPY 15,798.2.
- 52‑week range: Highest price JPY 24,940 (10 Jul 2026); lowest price JPY 8,010 (12 Nov 2025).
Comparative Performance of Related Stocks (Last 24 h)
| Ticker | 24‑Hour Change | Current Price (JPY) | Market Capitalisation (JPY bn) | P/E Ratio |
|---|---|---|---|---|
| Ns United Kaiun Kaisha (9110.T) | 0 % | 10,520 | 247.9 | 10.22 |
| Furuya Metal (7826.T) | –6.63 % | 9,120 | 248.5 | 14.45 |
| Pillar /Japan (6490.T) | –8.07 % | 9,770 | 249.4 | 21.56 |
| Edion (2730.T) | –1.44 % | 2,321 | 250.1 | 12.51 |
| Toho Bank /The (8346.T) | –5.96 % | 923 | 251.6 | 16.73 |
Key Observations
- Next Generation G experienced a modest decline of 3.31 % during the reporting period, while other listed companies largely trended downward, with Pillar /Japan showing the steepest decline at –8.07 %.
- The 200‑day moving average remains below the current price, indicating a bullish trend relative to the long‑term average.
- The 52‑week high and low demonstrate a substantial range, yet the current price is still near the 52‑week high, suggesting limited upside potential in the short term.
- The market capitalisations of the compared stocks are similar, ranging between JPY 247.9 bn and JPY 251.6 bn, indicating comparable company sizes within the sector.
These figures provide a concise snapshot of Next Generation G’s recent performance and its standing relative to peer companies.