
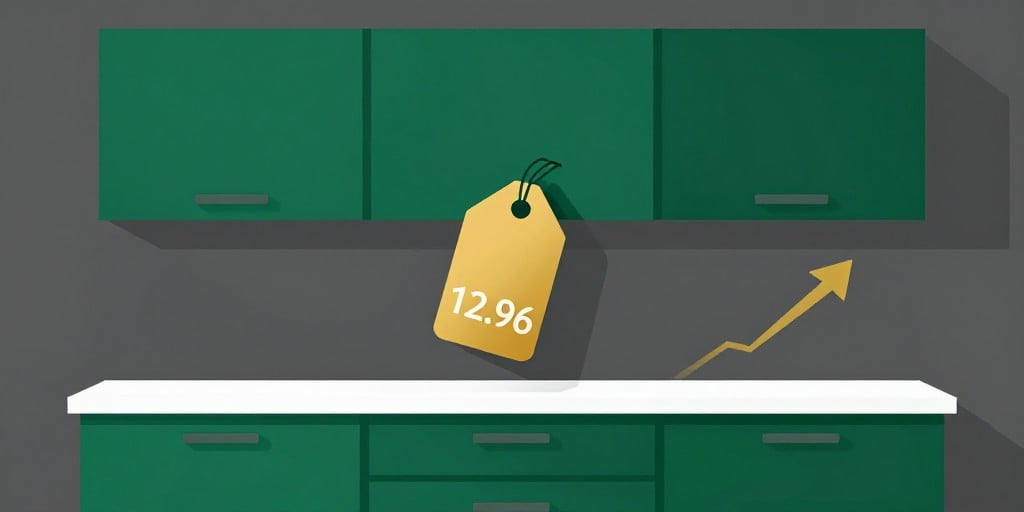
Nobia Stock Performance Overview (as of 21 Oct 2026)
- Price movement – Nobia (NOBI.ST) closed 1.59 % lower at 09:12 AM Central Europe.
- Current price – SEK 12.96.
- Shares outstanding – 151.1 million.
- Market capitalization – SEK 2 billion.
- Volume traded (last 24 h) – SEK 2.2 million.
- Monthly change – –6.76 % since the end of the previous month.
- 200‑day simple moving average – SEK 18.46.
- 52‑week high – SEK 37.26 (13 Jan 2026).
- 52‑week low – SEK 12.73 (19 Oct 2026).
Comparative Performance of Related Stocks (last 24 h)
| Company | Ticker | Price change | Current price | Market cap (SEK bn) |
|---|---|---|---|---|
| Vnv Global | VNV.ST | –1.75 % | SEK 18.08 | 2.3 |
| Verve Media | VER.ST | +1.39 % | SEK 11.76 | 2.3 |
| Arenit Industrie | ARENITSDB.ST | –1.98 % | SEK 103.5 | 2.4 |
| K‑fast | KFAST‑B.ST | –0.39 % | SEK 10 | 2.3 |
| Stille | STIL.ST | –0.39 % | SEK 260.5 | 2.3 |
Additional Ratios for Selected Stocks
- K‑fast (KFAST‑B.ST) – P/E ratio: 25.76.
- Stille (STIL.ST) – P/E ratio: 31.56.
Company Background – Nobia AB
Nobia AB is a Swedish manufacturer and marketer of kitchen interiors. Its product range is distributed through proprietary specialist kitchen stores and franchised showrooms. Production facilities are located in Sweden, Norway, Denmark, Finland, the United Kingdom, and Germany, and the company sells throughout the European market.